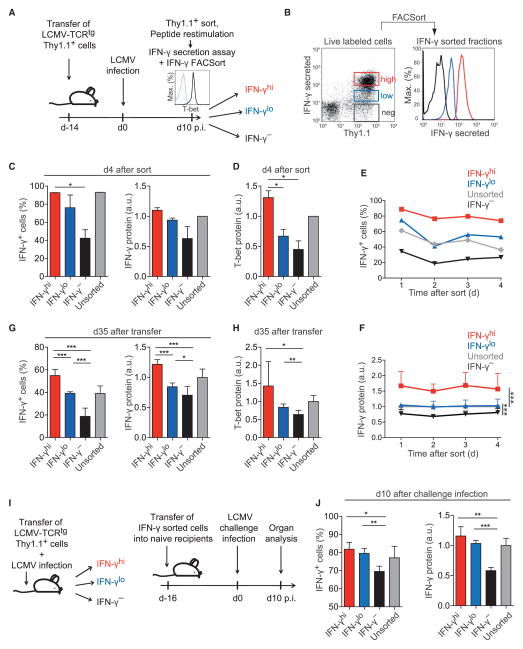
Figure 3. Individual Th1 Cells Exhibit a Stable Quantitative Memory for IFN-γ and T-bet Expression.
(A) Experimental set up of (B)–(D). WT recipients of 2 × 10⁵ LCMV-TCRtg CD4+Thy1.1+ T cells were infected with LCMV. Thy1.1+ cells were reisolated on day 10 and analyzed for T-bet expression (histogram inset; black, staining; gray, isotype control).
(B) Cells were restimulated with LCMV-GP64–80, sorted by secreted IFN-γ amounts, and cultured.
(C) Frequency of IFN-γ+ cells and normalized IFN-γ amount per cell in the sorted fractions on day 4 after sort.
(D) Normalized T-bet amounts per cell on day 4 after sort.
Representative results (B) and means + SD (C, D) of two experiments are shown.
(E and F) In-vitro-differentiated Th1 cells were sorted by secreted IFN-γ amounts and cultured with IL-2.
(E) Frequency of IFN-γ+ cells in the sorted fractions.
(F) Normalized IFN-γ amount per cell in the sorted fractions.
Representative results of three (E) and means + SD of two (F) independent experiments are shown.
(G and H) In-vitro-differentiated Th1 cells were sorted by secreted IFN-γ amounts, transferred into WT mice (1.5 × 10⁶ cells/mouse), and reisolated on day 35. Means + SD of two independent experiments are shown.
(G) Frequency of IFN-γ+ cells and normalized IFN-γ amount per cell in the sorted fractions.
(H) Normalized T-bet amounts per cell in the sorted fractions.
(I) Experimental setup of (J). WT recipients of 2 × 10⁵ LCMV-TCRtg CD4+Thy1.1+ T cells were infected with LCMV. Thy1.1+ cells were reisolated on day 10, restimulated with LCMV-GP64–80, sorted by secreted IFN-γ amounts, and transferred into naive WT mice (5 × 10⁴ cells/mouse). After 16 days, secondary recipients were infected with LCMV. On day 10 after challenge infection, Thy1.1+ cells were reisolated.
(J) Frequency of IFN-γ+ cells and normalized IFN-γ amount per cell in the sorted fractions are shown (means + SD of n = 3–4 mice).
See also Figures S4 and S5.

