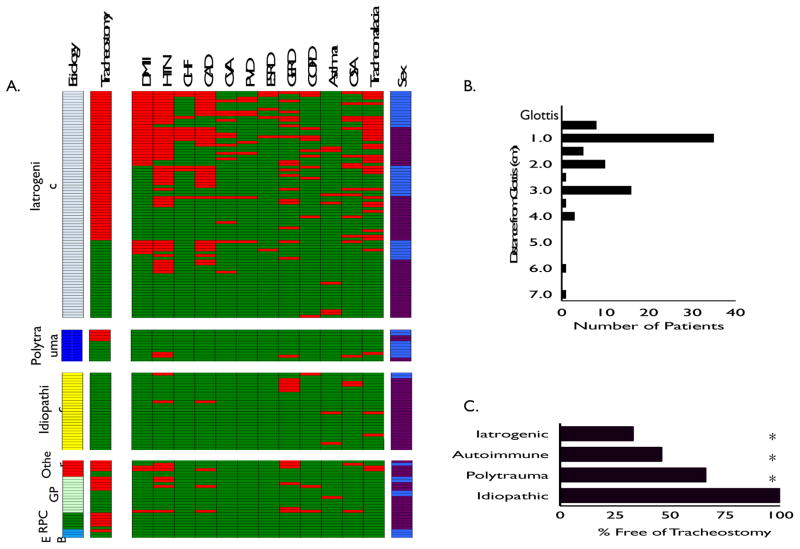
Figure 1.
Heatmap grouped by different etiologies of stenosis. Each line represents an individual patient. Tracheostomy status (red indicating trach), medical comorbidities (presence highlighted in red), and sex (blue indicating male, purple indicating female). In Autoimmune subgroup: GPA (granulomatosis with polyangitis, i.e. Wegener’s granulomatosis), RPC (relapsing polychondritis), EB (epidermolysis bullosa) (A.). Location of tracheal stenosis in iatrogenic injuries. Histogram showing location of stenotic lesion in iatrogenic subgroup in relation to distance from glottis (B.). Tracheostomy status of different etiologies at last f/u. Asterisk denotes statistical significance from idiopathic group (C.)

