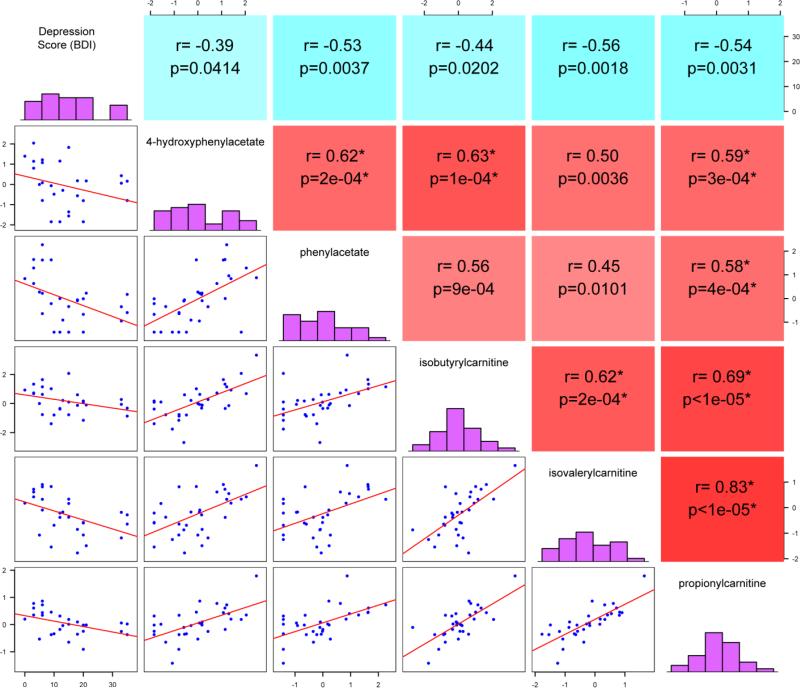
Figure 1. Inter-relationships between plasma metabolites and depression scores in HIV patients on ART.
Spearman correlation matrix visualization reveals inter-relationships between a set of 5 plasma metabolites and BDI scores in the HIV-positive test cohort (n=30). Comparisons were performed in a pair-wise manner and the correlation matrix was constructed in R. Diagonals display the histogram for each individual variable. Units displayed on the x-axis of the histogram represent depression scores (BDI) or metabolite concentrations (scaled intensities). Units on the y-axis represent numbers of subjects with values within the specified range for depression scale scores or metabolite concentrations. Panels to the right of the histogram show Spearman correlation coefficients and p-values. Red and blue represent positive and negative correlations, respectively.

