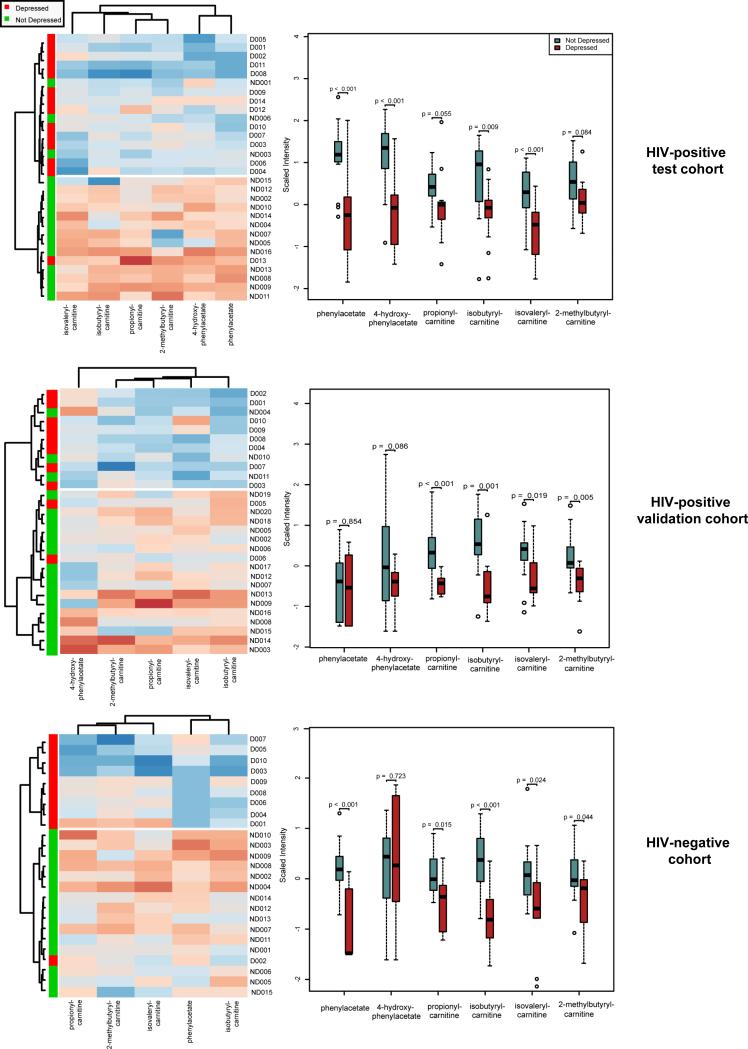
Figure 2. Plasma metabolites distinguishing between subjects with and without depressive symptoms in HIV-positive and HIV-negative cohorts.
On the left, heatmaps with unsupervised hierarchical clustering of signature metabolites (n=6; FC>1.2, p<0.01, FDR <10%) altered across independent cohorts of HIV-positive and HIV-negative subjects with compared to without depressive symptoms. Red and blue indicate increased and decreased metabolite levels, respectively. Subjects with versus without depressive symptoms (n=14 and n=16, respectively) from the HIV-positive test cohort were matched by age, gender, HCV status, type of ART regimen (% on protease inhibitors), drug use, and stage of disease (current and nadir CD4 count). Subjects with versus without depressive symptoms in the HIV-positive validation cohort (n=10 and n=20, respectively) were matched for age, gender, race, HCV status, % on ART, smoking, drug use, and stage of disease). Subjects with versus without depressive symptoms in the HIV–negative cohort (n=10 with and n=15 without depressive symptoms) were matched for age, gender, race, HCV status, smoking, and drug use. Dendrograms show clusters of similar subjects (top) and metabolites (left). On the right, box plots of metabolites altered in subjects with compared to without depressive symptoms. Medians are represented by horizontal bars, boxes span the interquartile range (IQR), and whiskers extend to extreme data points within 1.5 times IQR. Outliers plotted as open circles lie outside 1.5 times the IQR. Blue and red represent subjects without and with depressive symptoms, respectively. P-values were calculated using Welch's t-tests.

