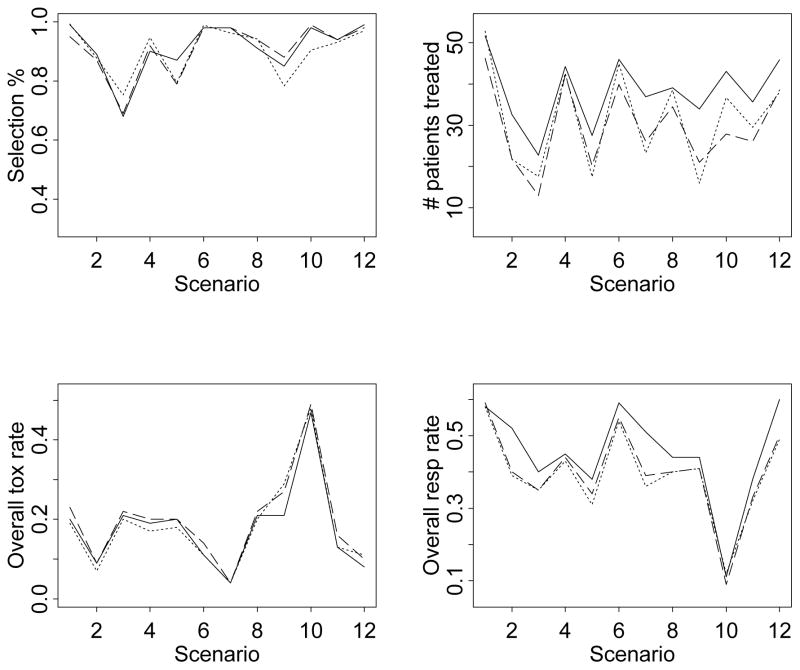
Figure 2.
Summary operating characteristics based on the simulations: —— two-dimensional BIT design . . . . . . one-dimensional BIT design – – – CRM+AR design. The top two plots are the selection percentages of the target dose-schedule combinations and the numbers of patients treated (averaged across 1000 simulated trials) at these combinations. The bottom two plots are the overall observed toxicity and response rates, calculated by dividing the total numbers of patients who experienced toxicity and efficacy, respectively, by the total numbers of patients treated in the 1000 simulated trials.

