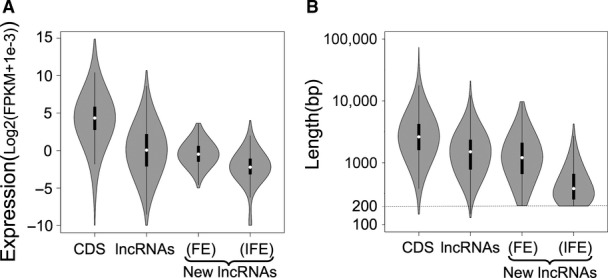
Figure EV2. Comparing the length and expression of newly assembled transcripts with transcripts in other categories.

- Violin plot comparing the maximum expression of each transcript in all cancer samples across gene categories. CDS corresponds to 17,529 protein-coding transcripts. lncRNAs represent 2,098 known noncoding RNAs from RefSeq database. FE and IFE: 521 frequently and 2,029 infrequently expressed transcripts, respectively, found in this study.
- Violin plot comparing the length of transcripts across gene categories. 200 bp was the length cutoff used for identifying these transcripts.
