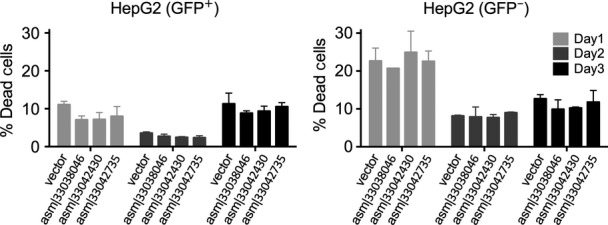
Figure EV5. Cell viability assay.

Shown are the percentages of dead cells in transduced (left) and non-transduced (right) cells, as measured by flow cytometry using viability dye over the course of 3 days. Error bars show standard deviation of the mean of two replicates.
