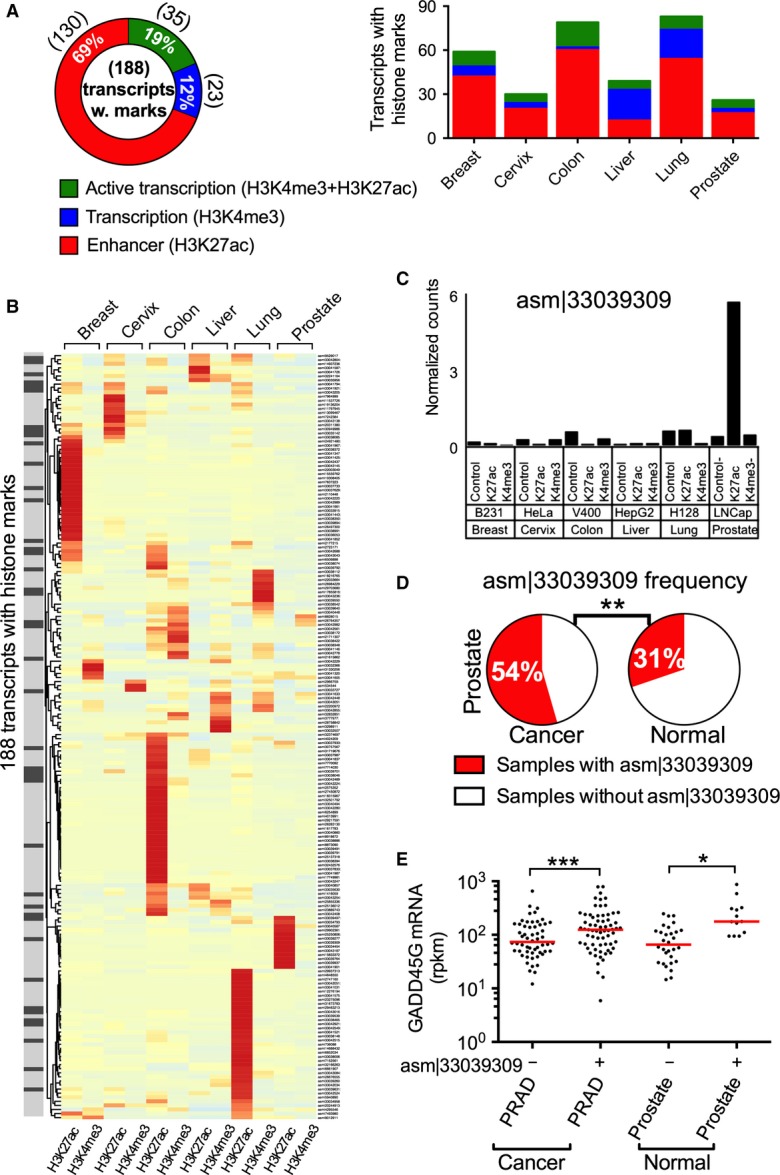
Figure 5. Histone marks at genomic loci of newly assembled transcripts.

- Distribution of H3K4me3 and H3K27ac histone marks in genomic loci of 188 transcripts with significant histone marks in one or more cancer cell line(s). Numbers in parentheses indicate the number of transcripts in each category. The stacked bar chart on the right shows histone mark distributions in each tissue type.
- Heat map of histone mark profiles for 188 transcripts across multiple tissues. For each transcript (rows), H3K27ac and H3K4me3 marks are shown in the indicated tissues (columns). The intensities of the colors are proportional to the negative log P-value of significance in each row. The gray-scale left-side bar highlights significant histone marks on transcripts that are frequently expressed in a tissue that matches that of the cancer cell line. When histone marks from multiple cancer cell lines existed for a tissue, the most significant one is shown for that tissue (see Table EV8 for complete results).
- H3K27ac and H3K4me3 marks on the genomic locus of the transcript asm¦33039309 in multiple tissues (when multiple cancer cell lines exist for a tissue, histone marks in a representative cancer cell line are shown).
- The expression frequency of asm¦33039309 in cancer and normal prostate samples. P-value (**P = 0.008) was calculated by two-sided Fisher's exact test.
- mRNA expression of the neighboring gene GADD45G for samples with or without asm¦33039309 expression in cancer and normal prostate samples. P-values (***P = 0.001, *P = 0.02) were calculated by two-sided Wilcoxon signed-rank test. The red lines show the median value.
