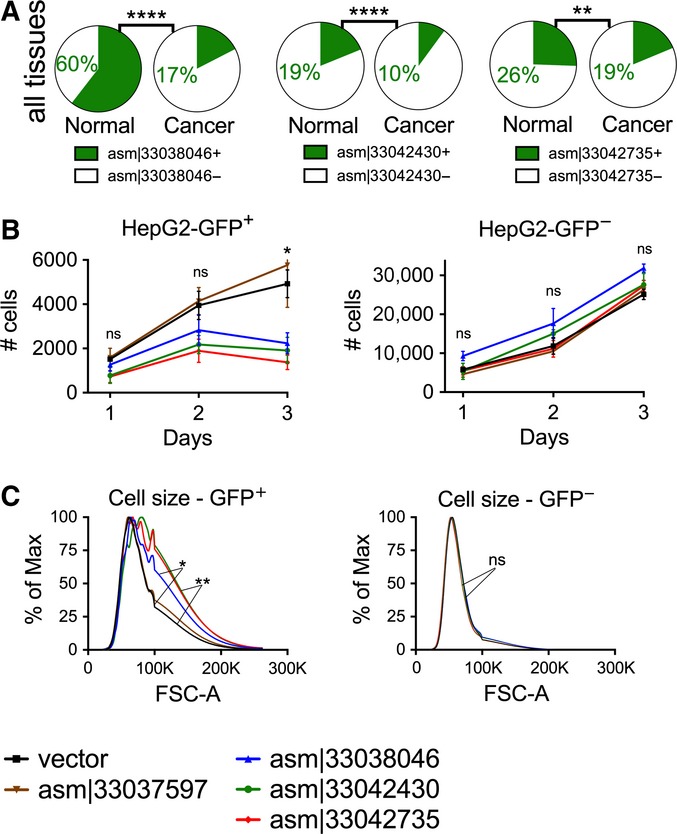
Figure 6. Transcripts asm¦33038046, asm¦33042430, and asm¦33042735 regulate cell growth in HepG2 cells.

- For each of these transcripts, two pie charts are shown with the frequency of expression in normal (left pie chart) or cancer (right pie chart) samples. Shown are the percentage of samples expressing (green) or not expressing (white) the transcript. asm¦33038046, asm¦33042430, and asm¦33042735 are each more frequently expressed in normal than cancer samples. P-values (****P < 0.0001, **P = 0.002) were calculated by two-sided Fisher's exact test.
- Lentiviral-mediated overexpression of transcripts in HepG2 carcinoma cells. Shown are the cell numbers over the course of 3 days after cellular transduction with vector or transcripts. Control transcript asm¦33037597 did not affect cell growth. The vector expresses GFP; thus, GFP+ cells represent the cells successfully transduced. GFP+ and GFP− cells are shown in the left and right panel, respectively. P-values (*P = 0.02) were calculated by two-sided t-test. Error bars show standard error of the mean.
- Cell size on day 3 after transduction of transcripts or empty vector in HepG2 carcinoma cells. Shown is the cell size, as measured by flow cytometry. Data represent the average of two replicates. P-values (*P = 0.011, **P = 0.007) were calculated by two-sided Wilcoxon signed-rank test.
