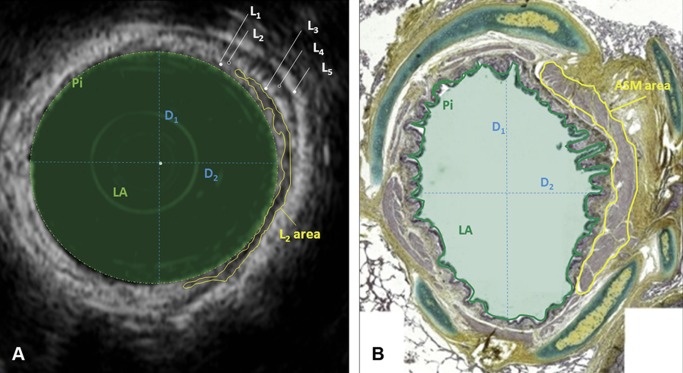
Fig 2. Measurements made on EBUS (A) and histological (B) images.
Only a part of L2 area and ASM area have been encircled in yellow, to allow the reader appreciate the rest of the image. L: US layer; D1 and D2: perpendicular diameters (blue dotted lines); LA: lumen area (filled light green area); Pi: airway perimeter (continuous green line).

