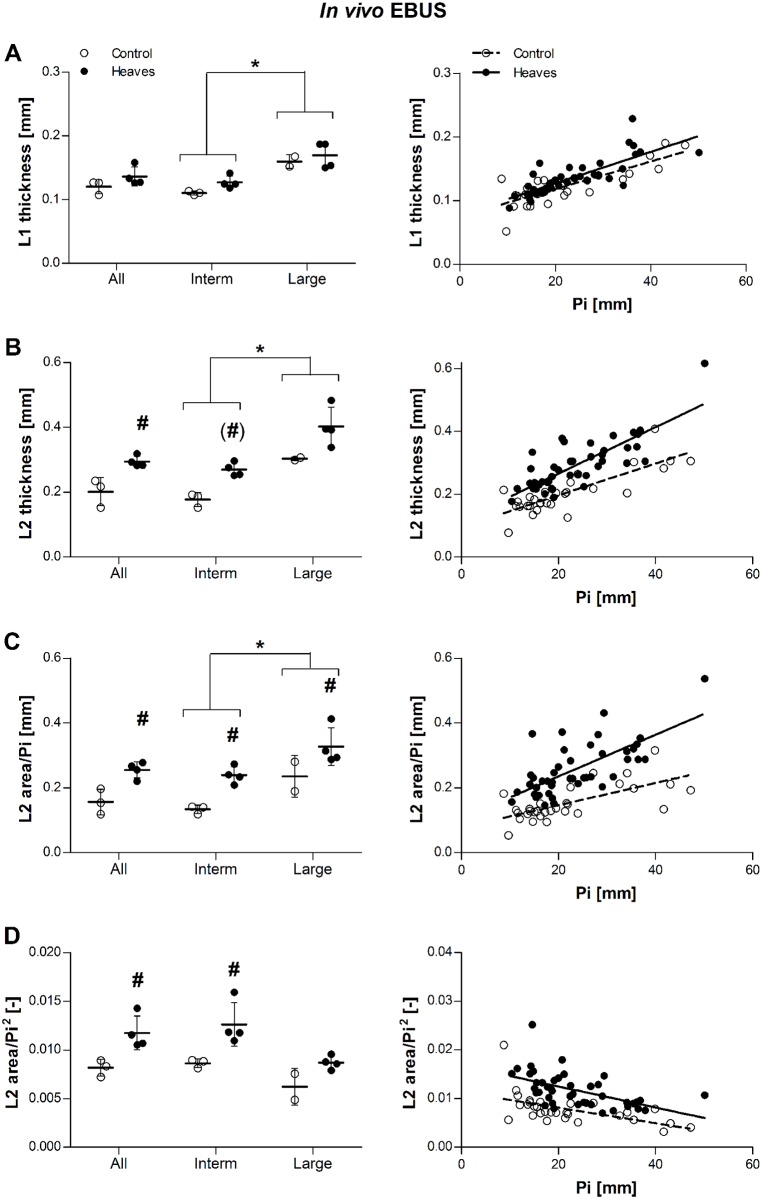
Fig 6. Effect of group and airway size on L1 thickness (A), L2 thickness (B), ratio L2 area/Pi (C), and ratio L2 area/Pi2 (D) in in vivo EBUS.
Raw data (before statistical corrections) are presented as mean per animal in the graphs on the left, and as mean per airway the graphs on the right. L1 and was similar in horses with heaves and controls across all bronchi (p = 0.27). Contrarily, L2 thickness, L2 area/Pi and L2 area/Pi2 ratios were greater in horses with heaves than controls across all bronchi (p = 0.03, p = 0.005 and p = 0.04, respectively). L1 values were similar in intermediate (Pi<31mm, p = 0.13) and large bronchi (Pi>31mm, p = 0.63) analyzed separately. L2 tended to be thicker in intermediate bronchi of horses with heaves than in controls (p = 0.03, non-significant after correction) but not in large bronchi (p = 0.13). Both L2 area/Pi and L2 area/Pi2 ratios were greater in intermediate bronchi of horses with heaves then controls (p = 0.003 and p = 0.02, respectively), but only L2 area/Pi ratios were greater also in large bronchi (p = 0.04; p = 0.22 for L2 area/Pi2 ratios). Overall, L1, L2 and L2 area/Pi values were greater in large than intermediate bronchi (p = 0.002, p = 0.005, and p = 0.01, respectively), while L2 area/Pi2 only tended to be greater in intermediate than in large bronchi (p = 0.05). L1, L2, and L2 area/Pi increased significantly with Pi in both groups (p<0.001 for all), while L2 area/Pi2 decreased significantly with increasing Pi (p<0.001). The slope of the relationship did not differ between the two groups for L1 and L2 area/Pi2 (p = 0.86 and p = 0.49, respectively), and it was significantly greater for L2 and L2 area/Pi (p = 0.02 and p = 0.04, respectively). Filled dots represent heaves and open dots represent controls. #: significantly different from controls. *: significant difference between values of intermediate and large bronchi (pooling the two groups).

