
Figure 3.
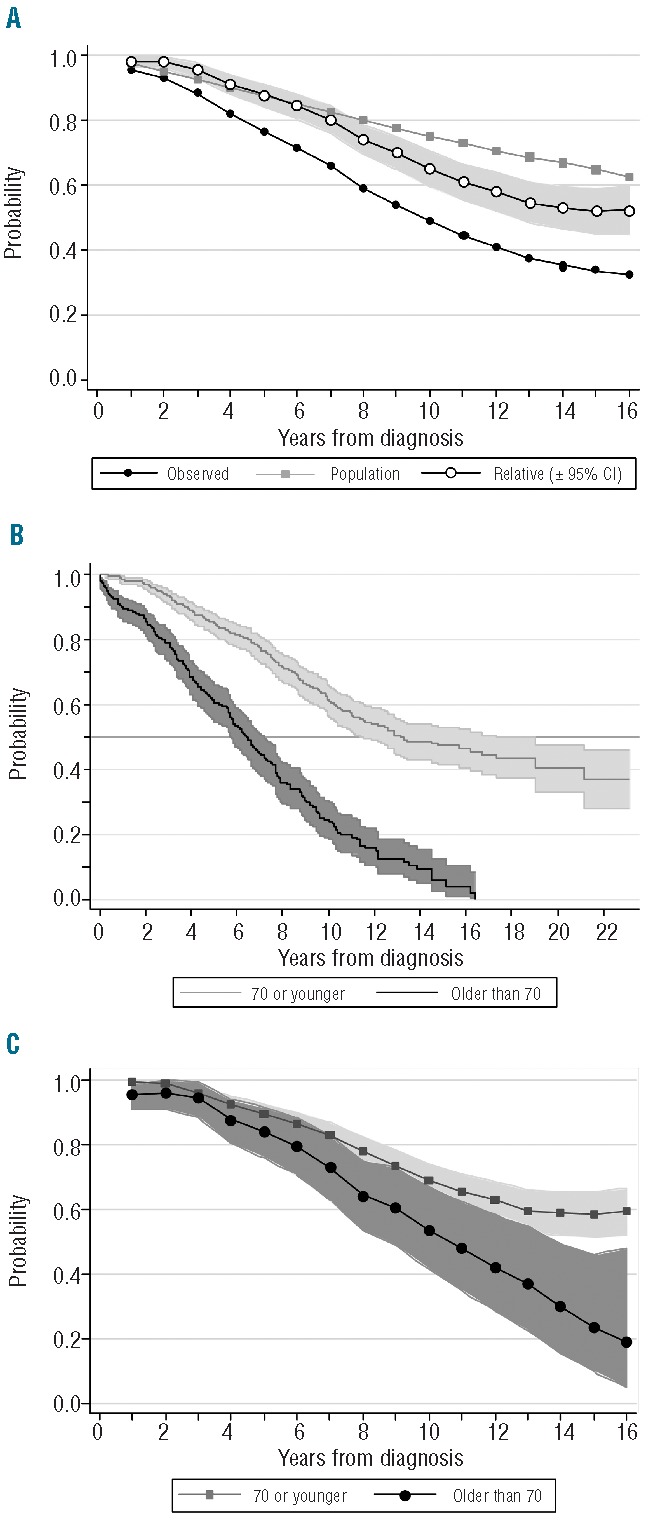
(A) Relative survival as the quotient of observed survival and predicted survival in the general population matched to the patients by age, sex and year of diagnosis. (B) Actuarial survival (Kaplan-Meier) and (C) relative survival according to age at diagnosis (70 or younger vs. older than 70). These curves were plotted using Stata (version 11.0).