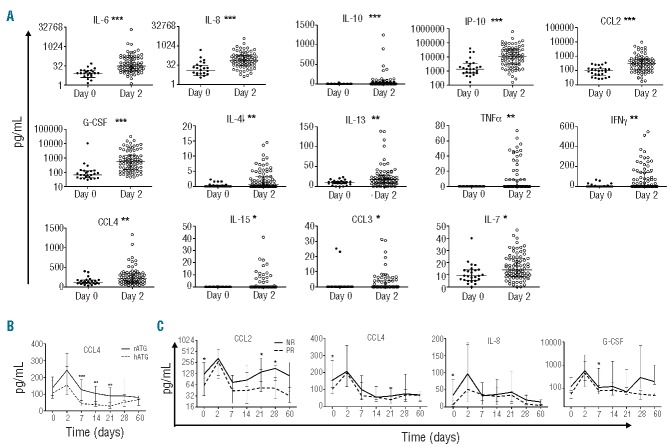
Figure 4.
Effect of ATG on cytokine levels. (A) “Cytokine storm” on day 2 in patients treated with rATG (n = 36) or hATG (n = 41). (B) Different effects of rATG (n = 36) or hATG (n = 41) on the cytokine CCL4. (C) Different cytokine levels between responders (n = 44) and non-responders (n = 33). The bars represent median and interquartile range. *P<0.05; **P< 0.01; ***P<0.001.

