
Figure 5.
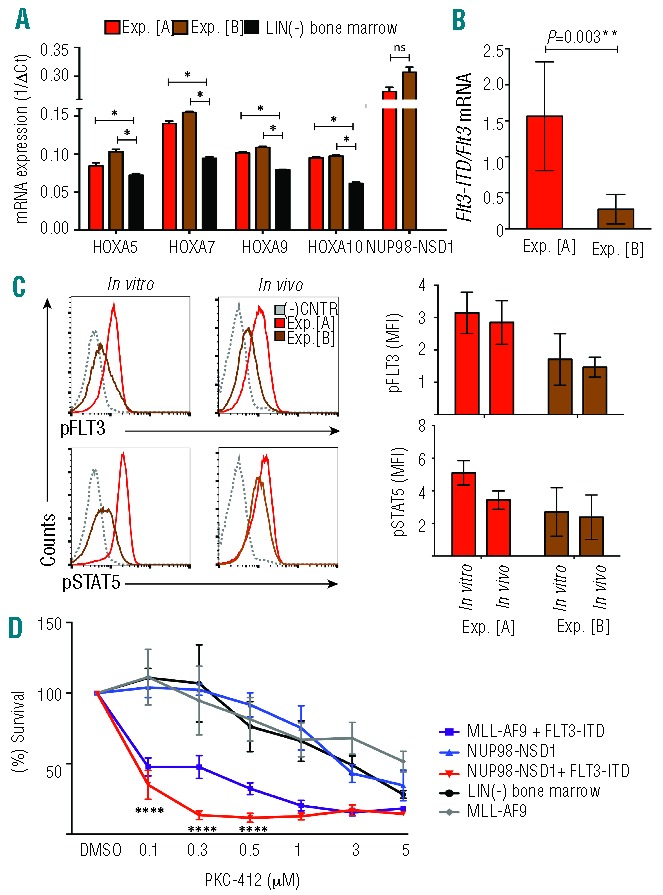
Increased FLT3-signaling in short-latency AML cells and sensitivity to a FLT3 inhibitor. (A) NUP98-NSD1 + FLT3-ITD expressing leukemic blasts from experiments “A” and “B” expressed significantly increased levels of HoxA5, HoxA7, HoxA9 and HoxA10 mRNA levels compared to lineage negative bone marrow cells. The expression of the NUP98-NSD1 was not different between experiments. Error bars represent the standard deviations from 2 experiments run in duplicates (t-test, two-tailed, unpaired/unequal variances, *P≤0.05). (B) NUP98-NSD1 + FLT3-ITD expressing leukemic blasts from transplanted mice express significantly different Flt3-ITD/wild-type Flt3 mRNA levels between experiment “A” and experiment “B” as detected by Q-PCR (P=0.003). A higher FLT3-ITD/wild type Flt3 mRNA ratio correlated with a shorter latency. The error bars indicate the standard deviation out of 5 analyzed mice per group in duplicates (t-test, two-tailed, unpaired/unequal variances, *P≤0.05). (C) Phospho-flow cytometric analysis for pFLT3 revealed that cells from experiment “A” express more pFLT3 than cells from experiment “B” both after in vitro immortalization and after in vivo AML induction. Similar results were found for pSTAT5. Graphs in the lower panel summarize the median fluorescence intensity obtained in 3 independent experiments. (D) Immortalized NUP98-NSD1 + FLT3-ITD co-expressing (Balb/C-derived) bone marrow progenitors are more sensitive to the PKC-412 small molecule FLT3 inhibitor than cells immortalized by NUP98-NSD1, MLL-AF9 fusion, or normal bone marrow cells. The graph represents survival of the cells after a 24-h-exposure to different doses of PKC-412 as assessed by a WST-1 assay performed in quadruplicates (t-test, two-tailed, unpaired/unequal variances, ****P≤0.0001).