
Figure 1.
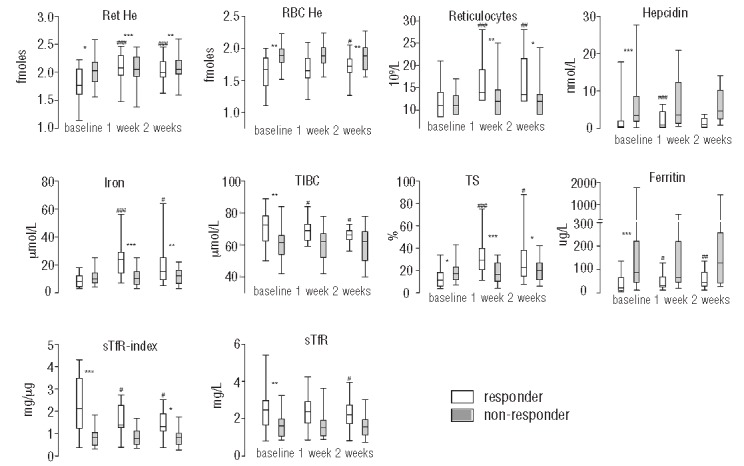
Box and whisker plots of iron status parameters at baseline and after one and two weeks of iron supplementation for responders (white) and non- responders (gray). *represent significant P- values of t-test comparisons or Mann Whitney tests between responders and non- responders. #represent significant P-values of paired samples t-test or Wilcoxon Signed Rank test comparisons between baseline and week one or week two of responders and non- responders. P-values xxx ≤ 0.001, xx ≤0.01, x <0.05. For abbreviations and SI conversion factors see Table 2. Reference values (when applicable): Ret- He 2.00- 2.41 fmoles, reticulocytes 20–80 109/L, hepcidin < 14.7 (males), < 12.3 nM (premenopausal females), <15.6 nM (postmenopausal women), iron 10–30 μmol/L, TIBC 45–80 μmol/L, ferritin 15–180 μg/L (males), 6–80 μg/L (premenopausal females), 15–280 μg/L (postmenopausal women), sTfR 0.76–1.76 mg/L.