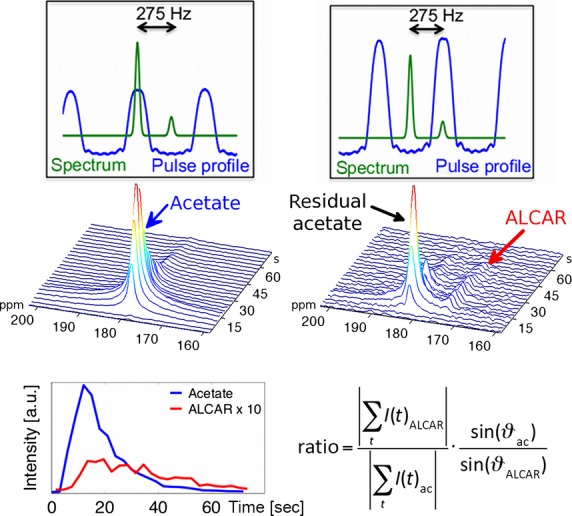
Figure 2.

First row: With an alternately excitation of acetate with 4° and ALCAR with 15° two sets of spectra are acquired (blue: spectral pulse profile; green: schematic spectrum). Second row: Representative spectra after acetate and ALCAR excitation. The ALCAR spectrum is dominated by the residual acetate signal at the first timepoints. However, the two signals are well separable. Third row: Time-course of the signal intensities (left) and quantification of the signal ratio with flip angle correction (right).
