Figure 3.

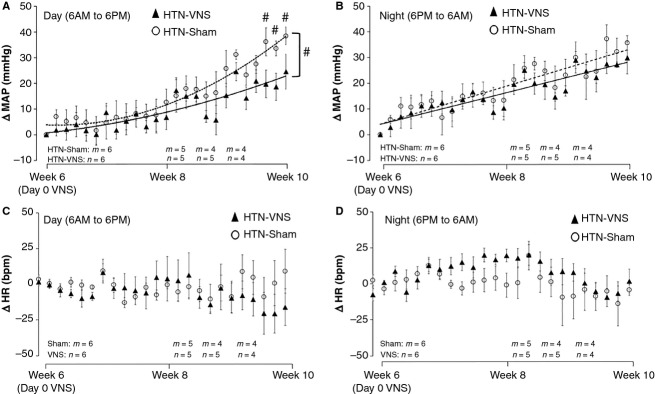
(A, B) ΔMAP and (C, D) ΔHR during the day (6 AM–6 PM) (panels A and C) and night (6 PM-6 AM) (panels B and D) for the HTN-Sham and HTN-VNS rats. # indicates statistical significance (P < 0.05) between HTN-VNS and HTN-Sham.

(A, B) ΔMAP and (C, D) ΔHR during the day (6 AM–6 PM) (panels A and C) and night (6 PM-6 AM) (panels B and D) for the HTN-Sham and HTN-VNS rats. # indicates statistical significance (P < 0.05) between HTN-VNS and HTN-Sham.