
Figure 2.
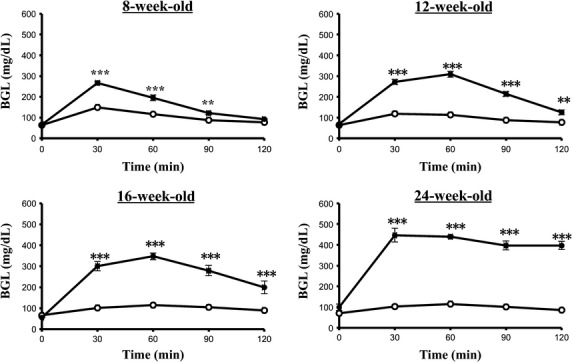
Blood glucose response during the OGTT (2 g/kg dose) in the Spontaneously Diabetic Torii (SDT) rats and the control SD rats. Experiments were performed after a 16-h fasting. Data are expressed as mean ± SEM (SD, n = 5; SDT, n = 4). Open and closed circles indicate the control SD rats and SDT rats, respectively. Significance: **P < 0.01 and ***P < 0.001 indicate statistical differences versus SD control rats at the same time point.