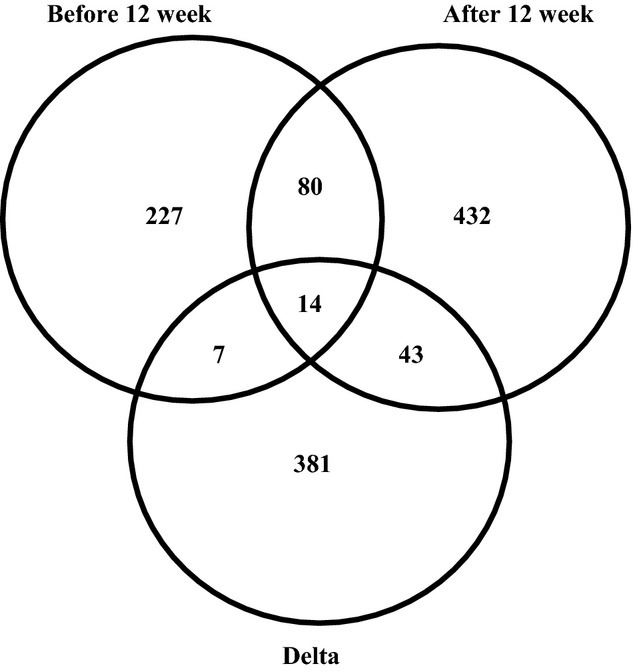
Figure 4.

Correlation analyses between the expression of PLIN4 and all other genes detected by mRNA sequencing in biopsies from m. vastus lateralis. The expression levels were correlated using Spearman’s test at before and after 12 weeks of training, and the change following long-term exercise (before 12 weeks – after 12 weeks). The Venn diagram shows the number of genes with correlation coefficients r > 0.5, and the overlapping areas represent the number of genes that are correlated in two or all data sets.
