Figure 3.

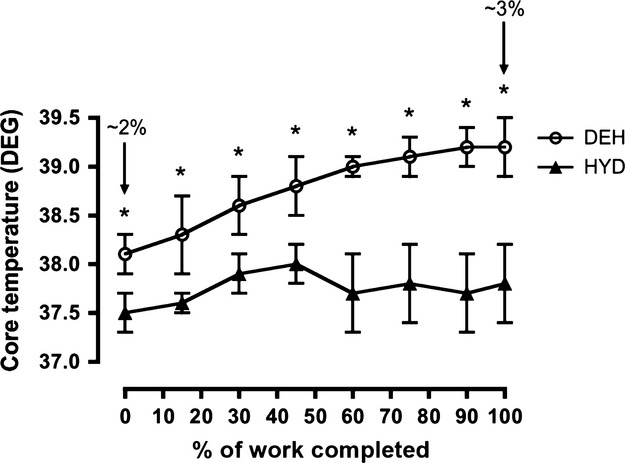
Core temperature (DEG) during the time trial (TT) in the hydrated (HYD) and dehydrated (DEH) trials. Values are mean ± SD (n = 9). *Significantly greater than HYD trial (P < 0.05). Arrows (↓) indicate ∼1%, ∼2%, and ∼3% BM loss.

Core temperature (DEG) during the time trial (TT) in the hydrated (HYD) and dehydrated (DEH) trials. Values are mean ± SD (n = 9). *Significantly greater than HYD trial (P < 0.05). Arrows (↓) indicate ∼1%, ∼2%, and ∼3% BM loss.