Figure 2.
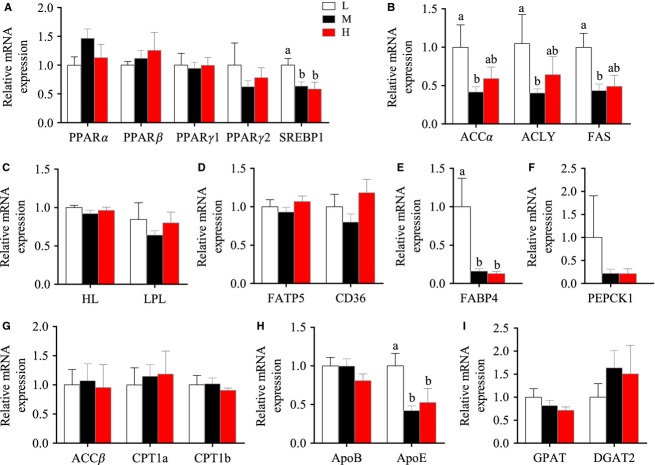
The mRNA expression of the genes in hepatic triglyceride (TG) metabolism of Nile tilapia fed with diets containing low (1%), medium (7%), and high (13%) lipid content for 10 weeks. (A) The relative mRNA abundance of PPARα, PPARβ, PPARγ1, PPARγ2, and SREBP1 in liver. (B) The relative mRNA abundance of ACCα, ACLY, and FAS showing the FA biosynthetic activity de novo. (C) The relative mRNA abundance of HL and LPL showing the ability of triglyceride hydrolysis. (D) The relative mRNA abundance of FATP5 and CD36 showing the ability of FA uptake. (E) The relative mRNA abundance of FABP4 showing the activity of intracellular FA transport. (F) The relative mRNA abundance of PEPCK1 participating in the pathway of glyceroneogenesis. (G) The relative mRNA abundance of ACCβ, CPT1a, and CPT1b showing the activity of FA β-oxidation. (H) The relative mRNA abundance of ApoB and ApoE which are important components of VLDL. (I) GPAT and DGAT2 showing the activity of TG synthesis. All values are means ± SEM (n = 6). Values with different letters on columns statistically differ at P < 0.05.

