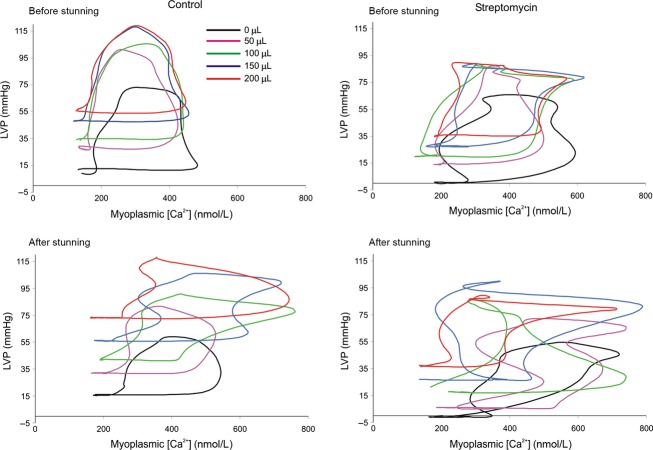
Figure 4.
Representative phase–space diagrams of LVP versus [Ca2+] before and after stunning in STM-treated and CON hearts. These diagrams were quantified using indices of area (LVP × Ca2+) and orientation (phasic LVP/phasic [Ca2+]). Note the more uniform response to stretch before stunning than after stunning and the tendency of stretch to increase LVP but not [Ca2+] before stunning more so in the CON than in the STM group. After stunning, stretch increased both LVP and [Ca2+] in the CON group whereas LVP was reduced and [Ca2+] unchanged by stretch in the STM group.

