
Figure 6.
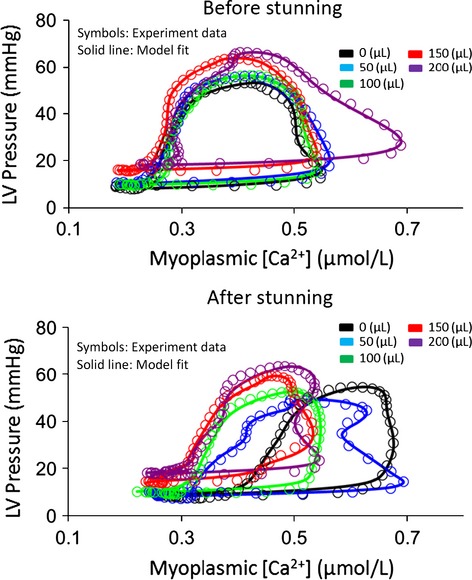
Phase–space characterization of experimental LVP (symbols) and modeled LVP (smooth line) versus myoplasmic [Ca2+] during myocardial stretch before and after stunning for one representative cycle in each stretch group. The model fitted the data with less than 5% error in any cycle.