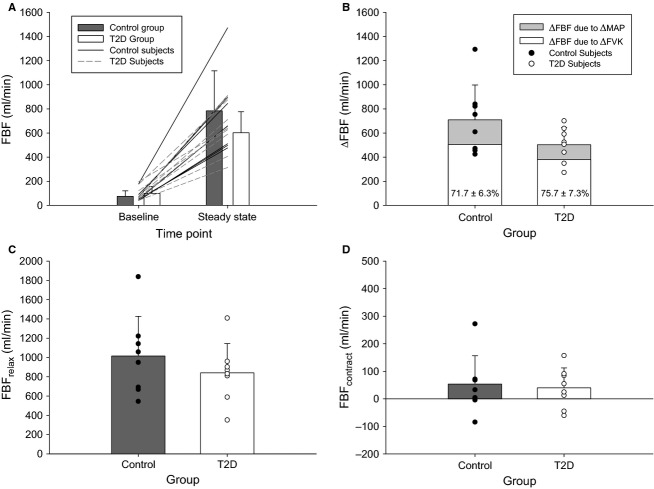
Figure 4.
Forearm blood flow. (A) Absolute FBF at rest and during the last 30 sec of the fCFimpulse test (“steady state”) in the control (gray bars) and T2D (white bars) groups. Lines represent individual participant data (solid = control participants; dashed = T2D participants). (B) Change in FBF from resting baseline to the last 30 sec of the fCFimpulse test. White shading represents the predicted ΔFBF if only FVK changed (MAP constant), with the remaining gray shading due to the addition of a change in MAP. Inset percent values indicate the proportional contribution of ΔFVK to ΔFBF. (C) Absolute FBFrelax and (D) FBFcontract during the last 30 sec of the fCFimpulse test. Data are means ± SD; closed symbols = control group, open symbols = T2D group. FBF, forearm blood flow; fCF, forearm critical force; FVK, forearm vascular conductance; MAP, mean arterial pressure.

