
Figure 4.
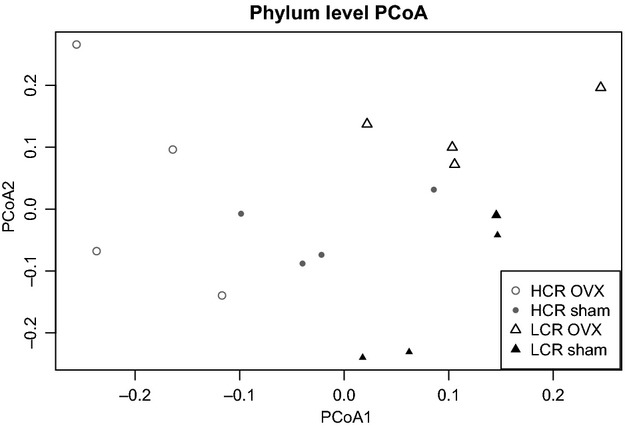
Principal coordinate analysis (PCoA) illustrates clustering of fecal bacterial community by OVX status with LCR rats and HCR rats. PCoA utilized the Jaccard distance matrix with OTU relative abundances at 3% genetic distance. Cluster centroids are significantly different for LCR OVX versus LCR Sham and LCR OVX versus HCR OVX, but not for HCR OVX versus HCR Sham or LCR Sham versus HCR Sham via AMOVA test; P < 0.05.