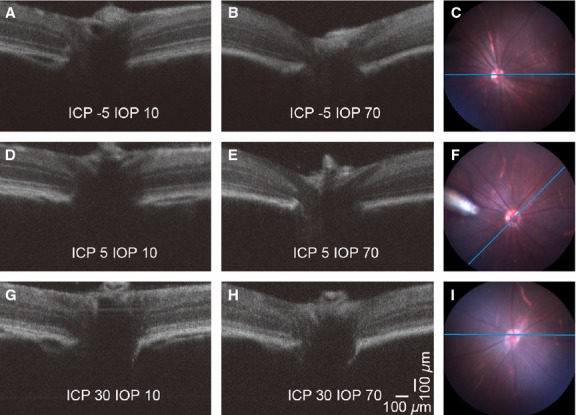
Figure 3.

Representative OCT images showing the effect of IOP and ICP modification on the retina and ONH. Images in each row were acquired from the same rat, and the three rows indicate low (A, B; −5 mmHg) normal (D, E; 5 mmHg) and high (G, H; 30 mmHg) ICP levels. Panels on the right (C, F, I) show the corresponding full field fundus images. The blue reference line denotes the location of the OCT scan. In panel (F) the tip of the intravitreal cannula can be visualized at 9 o’clock. In this case the scan was taken at 45 degrees to the horizontal. In all other cases the reference was within 10 degrees of horizontal. The left and middle columns compare the effect of normal (A, D, G; 10 mmHg) and elevated IOP (B, E, H; 70 mmHg) on the structure of the peripapillary tissue and the optic nerve head. Note the backward bowing and remarkable retinal compression at IOP 70 mmHg (E) which is partially prevented by raising ICP (H).
