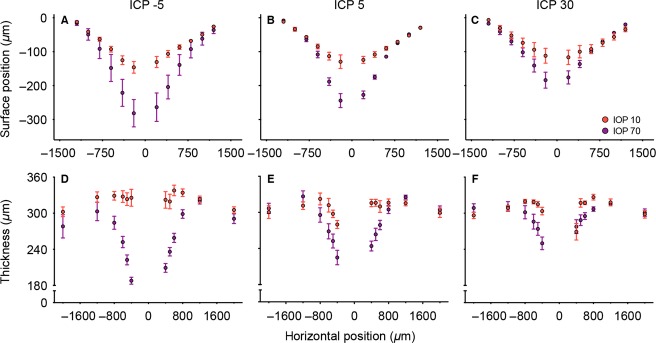
Figure 4.

Group average effect of IOP and ICP on surface position and retinal thickness. Data are shown as mean (±SEM) for three selected ICP levels (low −5, normal 5 and high 30 mmHg) and two selected IOP values (normal 10 and high 70 mmHg). (n = 6–7). The complete range of IOP levels is illustrated in Fig. S3. For each ICP level (mmHg) the IOP is denoted by 10 = red, 70 = purple. Surface position is shown in panels (A–C) whereas panels (D–F) show retinal thickness.
