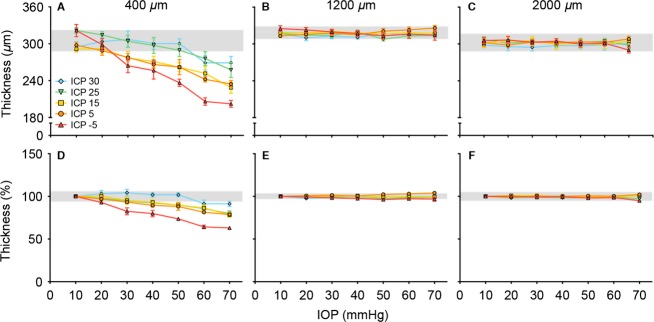
Figure 6.

Effect of ICP on IOP-induced changes in retinal thickness. (A) Retinal thickness at 400 μm, (B) 1200 μm and (C) 2000 μm from the midline. (D–E) show retinal thickness normalized to baseline IOP for the same three locations (n = 6–7 in each group, mean ± SEM). Retinal thickness was averaged from both temporal and nasal sides of the optic nerve for each eye.
