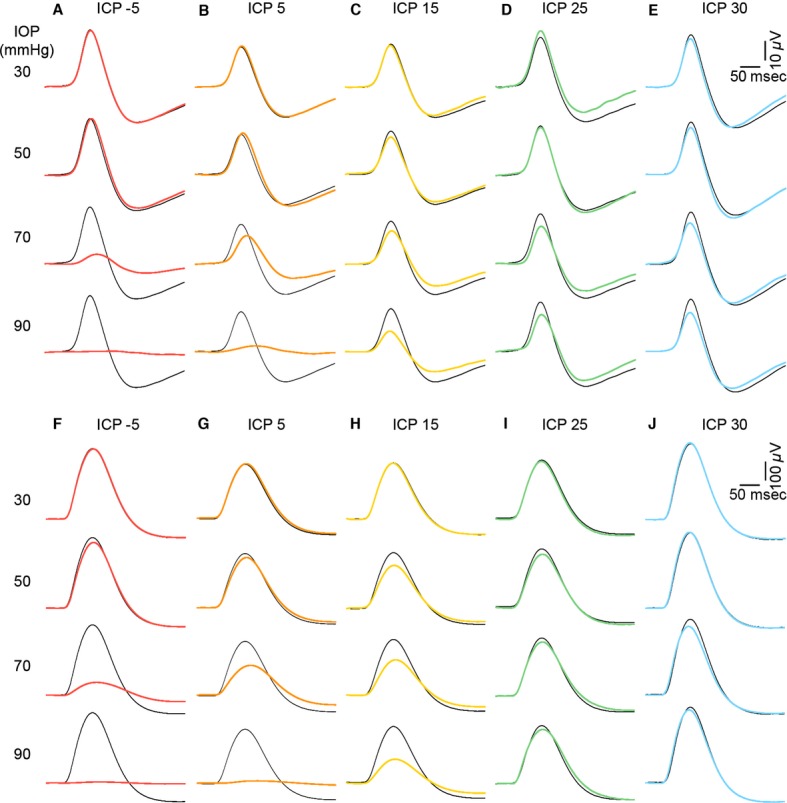
Figure 7.

Effect of ICP modification on IOP-induced changes to electroretinogram waveforms. Group average ERG waveforms of panels (A–E), scotopic threshold responses indicating proximal retinal function. (F–I) b-wave representing ON-bipolar cell function. Black thin traces indicate waveforms measured at baseline (IOP = 10 mmHg) for each ICP group. Colored traces indicate ERG responses following IOP elevation. Warmer colors represent low ICP and cooler colors high ICP levels.
