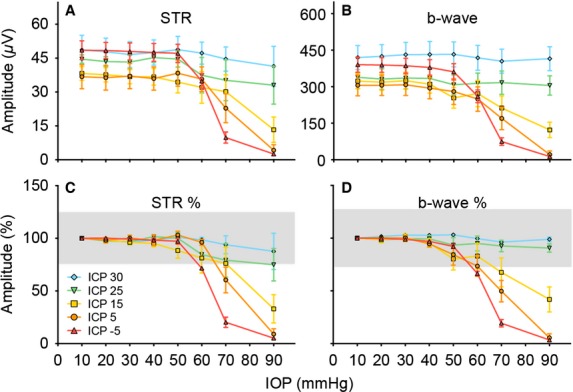
Figure 8.

Group average effects of IOP and ICP on the electroretinogram. Mean amplitudes (±SEM, n = 5–9 in each group) of for the raw STR (A) and b-wave (B). These data were also expressed normalized to baseline (IOP = 10 mmHg) (C and D). The grey area indicates the 95% confidence interval of baseline amplitudes (IOP = 10 mmHg).
