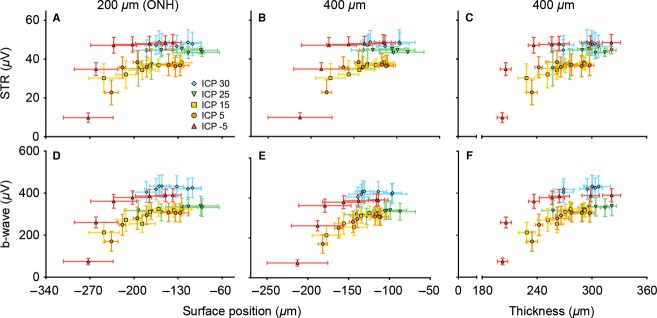
Figure 11.

Structure-function relationships with ONPG modification. Structural parameters (on x-axis) of surface position and thickness are plotted against functional output in terms of ERG amplitude (on y-axis) of ganglion and bipolar cells. All structure-function relationships exhibit a curvilinear relationship. Data expressed as mean (±SEM).
