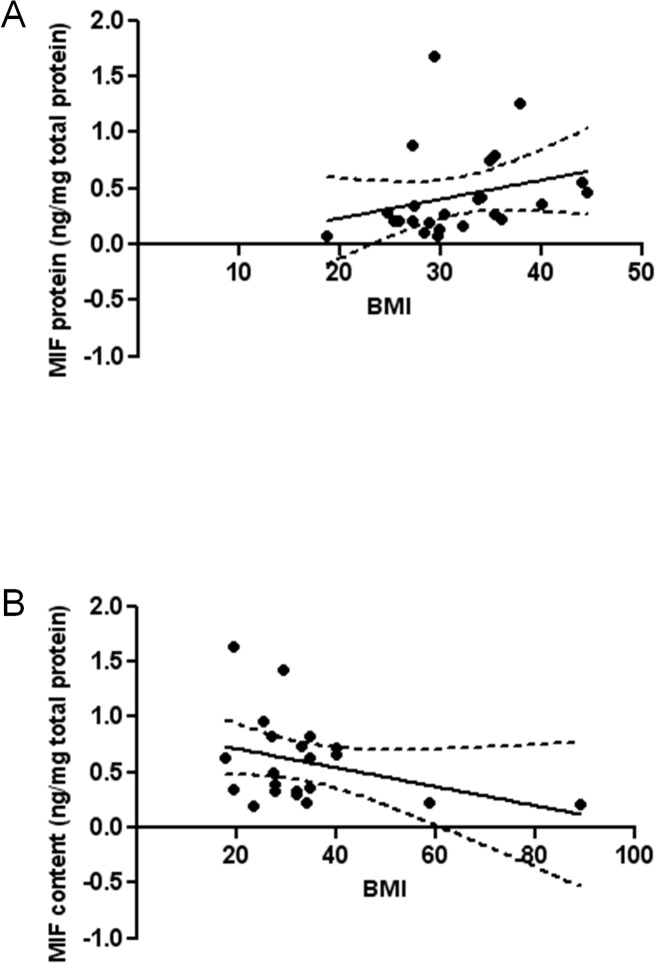
Fig 4. Correlation of MIF protein with donor’s BMI.
MIF protein levels from native adipose tissue were correlated (Spearman’s rank order correlation) with the BMI of the donor. The linear regression curve is depicted by a solid line, the 95% confidence interval by a dotted line. A MIF protein levels and BMI from donors of HAT show a significant positive correlation (p<0.05, Spearman r = 0.39). B MIF protein levels and BMI from donors of IAT show no significant correlation (p = 0.32, Spearman r = -0.23).

