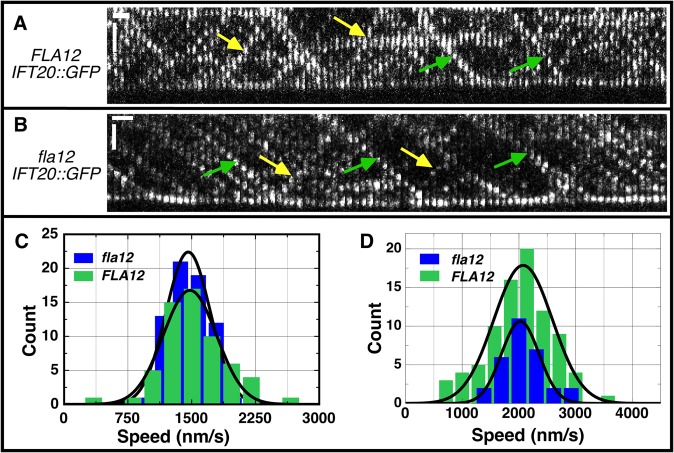
Fig 5. IFT velocities are not changed in the fla12 mutant.
Kymographs of IFT20::GFP in (A) FLA12 and (B) fla12 strains. Green and yellow arrows denote representative anterograde and retrograde tracks, respectively. Vertical scale bar, 2 μm; horizontal scale bar, 1 sec. (C) The anterograde IFT velocities were 1478 ± 41 nm/s (mean ± SEM) for FLA12 cells (green, n = 60) and 1460 ± 32 nm/s for fla12 cells (blue, n = 67). (D) The retrograde IFT velocities were 2074 ± 56 nm/s for FLA12 cells (green, n = 84) and 2023 ± 60 nm/s for fla12 cells (blue, n = 30).

