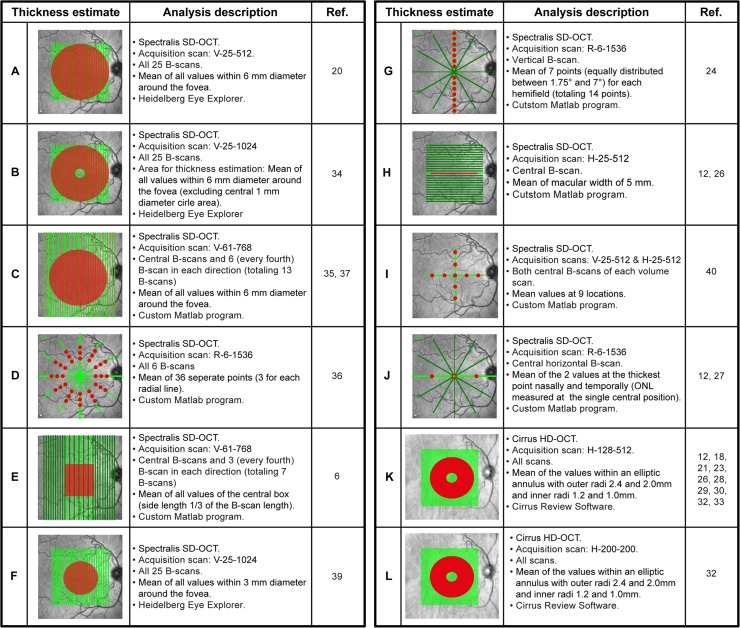
Fig 3. Explanation of different thickness estimates used for the simulation of repeatability.
The red areas or points on the fundus images indicate the values that were averaged to generate the layer thickness estimates. The text to the right of each image refers to (top-to-bottom): 1) the used OCT device 2) the applied scan as elucidated in Fig 1; 3) the (subset of) B-scans used for the thickness estimate; 4) the procedure used to calculate the thickness estimates; 5) the program used for calculating the thickness estimate. The last column indicated the article(s) in which the layer estimated was applied. For a detailed overview of the segmentation methods applied in the retrieved articles, see Table B in S1 File. Note: the number and spacing of B-scans on the fundus image for the thickness estimates C and E are not correct due to space limitations.

