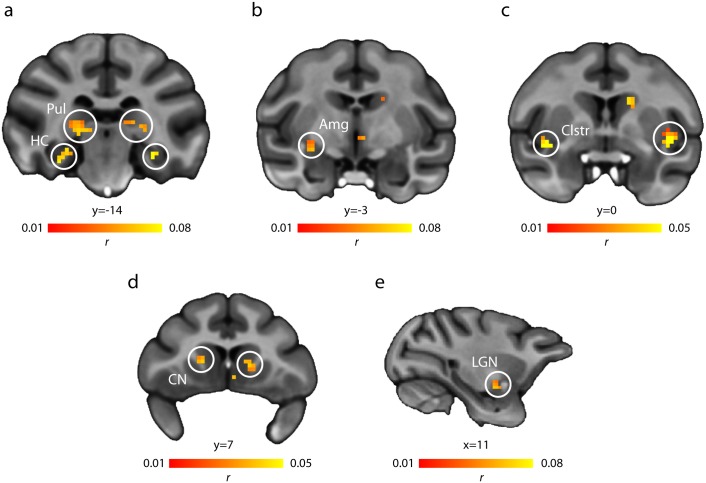
Fig 3. Subcortical FC of the face patches.
A conjunction analysis of the rsfMRI maps of face patches AF, AL, MF, ML, and PO revealed FC with several subcortical areas. (a) Pulvinar and hippocampal formation (FDR corrected at q = 0.025); (b) amygdala (FDR corrected at q = 0.005); (c) claustrum (FDR corrected at q = 0.025); (d) caudate nucleus (FDR corrected at q = 0.025); (e) lateral geniculate nucleus (FDR corrected at q = 0.005). Results are overlaid on coronal (a–d) and sagittal (e) slices of the MNI-Paxinos template brain, in radiological convention (left is right). Coordinates are relative to the center of the anterior commissure. Cortical results are masked for display purposes. Note different scaling of correlation coefficients in (c) and (d).

