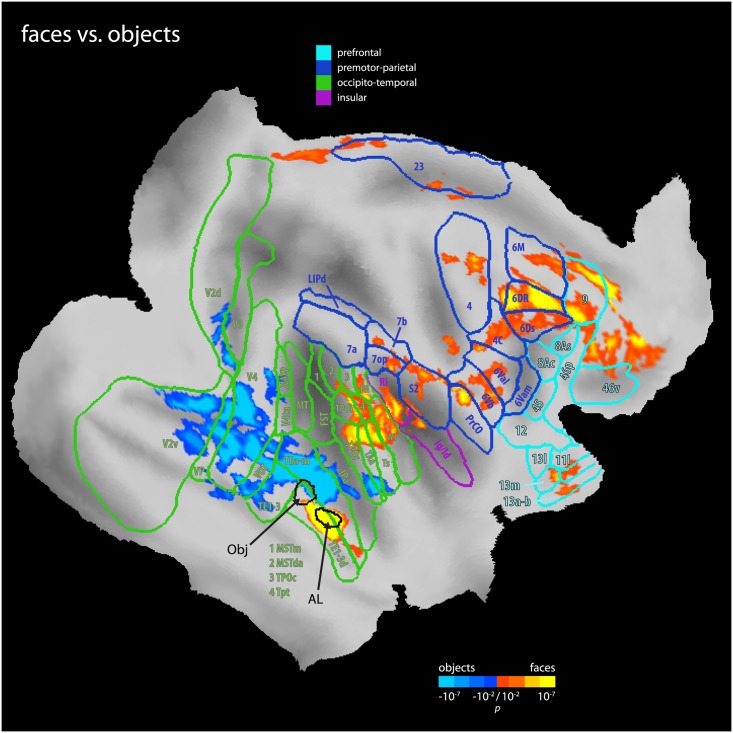
Fig 4. Differential FC of face versus object patches.
Results of the contrast of face patch AL against an object patch connectivity (corrected for multiple comparisons using cluster size thresholding at p < 0.05) on an inflated and flattened right hemisphere in F99 space. The two seed regions were neighboring each other in the anterior lip of the STS (representative locations marked with arrows and black outlines, average distance 4.1 mm). Warm colors show areas in which face patch connectivity was stronger than object patch selectivity, while cold colors show the reverse. As can be seen, the face patch AL showed a connectivity pattern distinct to that of the object patch, despite their close proximity. AL was more connected with the upper bank of the STS (including area TPO), the insula, lateral, and medial parietal cortex (including area 7 and 23, respectively), lateral and medial prefrontal cortex (including areas 6Val, 6Vb and 6M, 9, respectively), and orbitofrontal cortex (area 13). In contrast, the object patch was more connected with the inferotemporal cortex (including area TE) as well as the ventral occipital cortex (including area VOT). Highlighted are four networks of FC: areas in prefrontal cortex (light blue), a premotor-parietal network (blue), occipitotemporal cortex (green), and the insula (purple). Areal boundaries are from Lewis & van Essen [35] and include all areas from the conjunction of face patches analysis (Fig 2) for comparison.

