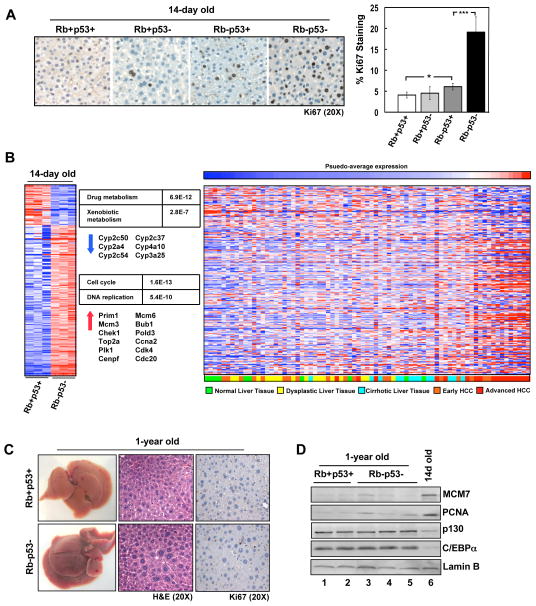
Figure 1. RB/p53 loss in the liver promotes cell cycle deregulation but not spontaneous tumor formation.
(A) Left, Ki67 staining in 14-day old livers. Right, percentage Ki67-positive hepatocytes (*p=0.03; ***p<0.0001). (B) Gene expression data for 14-day old, RB/p53-deficient mouse livers compared to wild-type livers. Left, changes in gene expression displayed as a heat map. Center, KEGG Pathway analysis with corresponding P-values and representative genes. Right, human liver samples (GSE6764) clustered based on average intensities of deregulated genes in RB/p53-deficient mouse livers. (C) Dissected 1-year old mouse livers, H&E and Ki67-stained sections. (D) Total protein lysates from 1-year old and 14-day old livers immunoblotted for the indicated proteins.

