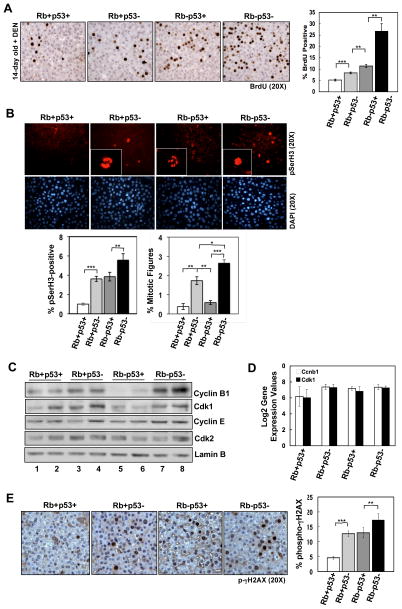
Figure 3. p53 loss is required for mitotic progression in response to hepatocarcinogen.
(A) Left, BrdU staining in 14-day old, DEN-treated livers. Right, percentage BrdU-positive hepatocytes (**p<0.002, ***p=0.0006). (B) Top, pSerH3 staining in 14-day old, DEN-treated livers. Insets display representative mitotic figures (anaphase and prophase for Rb+p53− and Rb-p53−, respectively) or staining indicative of G2-arrest (Rb-p53+). Bottom, percentage pSerH3-positive hepatocytes (**p=0.0067, ***p=0.0008) and mitotic figures (*p=0.02; **p=0.003, ***p<0.0001). (C) Total protein lysates from 14-day old, DEN-treated livers immunoblotted for the indicated proteins. (D) Normalized Log2 gene expression values for Ccnb1 and Cdk1 from microarray analyses. (E) Left, p-γH2AX staining in 14-day old, DEN-treated livers. Right, percentage p-γH2AX-positive hepatocytes (**p=0.0069; ***p<0.0001).

