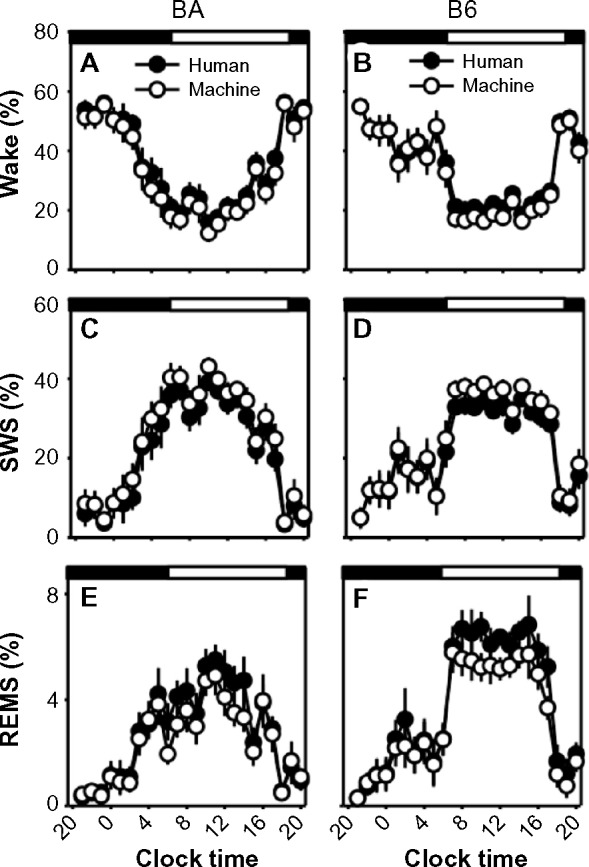
Figure 4.

Sleep-state percentages in human-scored versus machine-scored 10-second epoch data.
Notes: Data from the BA strain (left column) and the B6 strain (right column), were binned into 60-minute intervals. Graphs represent the percentage of each interval spent in wake (A and B), SWS (C and D), and REMS (E and F). Open circles represent machine-scored data and filled circles represent human-scored data. Dark and light phases are indicated by black and white bands at the top of each panel.
Abbreviations: B6, C57BL/6J mice; BA, BALB/CJ mice; REMS, rapid-eye-movement sleep; SWS, slow-wave sleep.
