Figure 7.
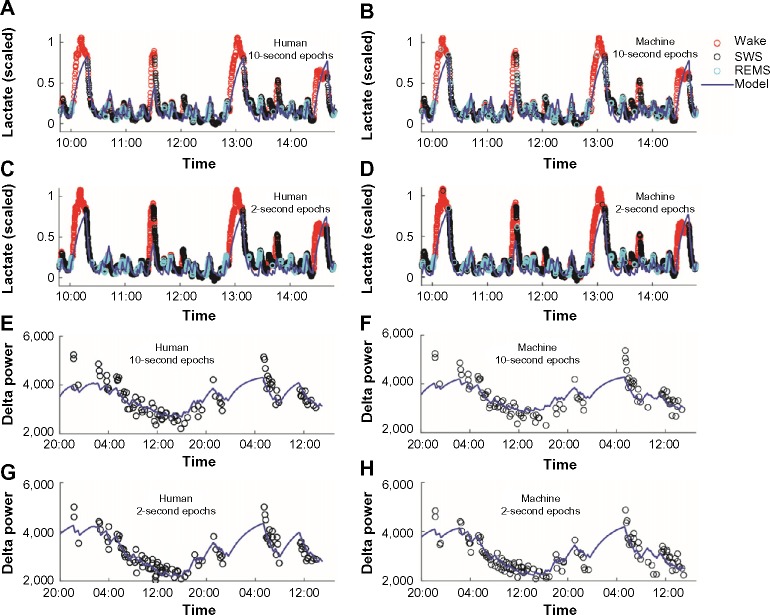
Homeostatic modeling of lactate data and SWA scored by human or machine.
Notes: The left column shows human-scored data and the right-hand column shows machine-scored data. The top four panels show scaled lactate data in 10-second epochs scored by a human (A), 10-second epochs autoscored (B), 2-second epochs scored by a human (C), and 2-second epochs autoscored (D). The bottom four panels show SWA in 5-minute sleep episodes using 10-second epochs scored by a human (E), 10-second epochs autoscored (F), 2-second epochs scored by a human (G), and 2-second epochs autoscored (H). In each panel, a homeostatic model for lactate or SWA was fit to the data (solid curve). The difference in time scale between the lower panels and the upper panels reflects the difference in temporal dynamics of SWA versus those of lactate.
Abbreviations: REMS, rapid-eye-movement sleep; SWA, slow-wave activity; SWS, slow-wave sleep.

