
Figure 32.
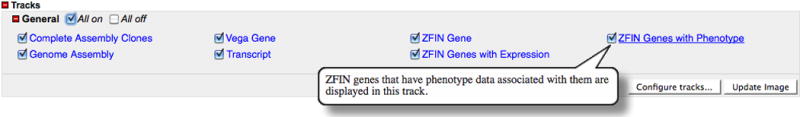
GBrowse tracks available for the zebrafish genome. The Assembly tracks show the components used in the Vega assembly. The Gene and Transcript tracks show schematic representations of the gene and the exon structure of the transcripts, with arrows indicating their orientation in the genome. The Expression and Phenotype tracks are ZFIN-specific tracks indicating the presence of associated data in the ZFIN database. Selecting and de-selecting the check boxes and updating the image allow customization of the Details view.