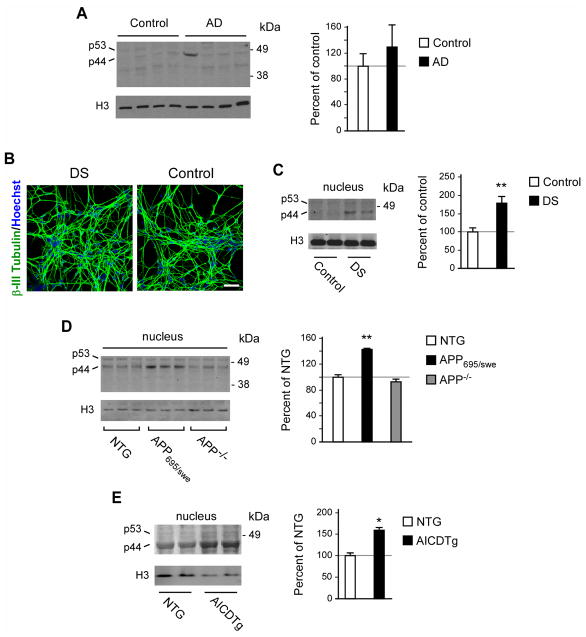
Fig. 2. p44 levels in the brain of late-onset AD patients, human trisomy 21 neurons, and brain of APP695/swe and AICDTg mice.
(A) Western blot showing levels of p53 and p44 in the brain of AD patients (mean age: 71 yr; range: 67–91 yr; sex: males) and age-matched controls (mean age: 70 yr; range: 66–78 yr; sex: males). Only the nuclear fraction was analyzed. Representative images are shown in the left panel while quantification is shown in the right panel. (B) Neurons differentiated from DS and control iPSCs. (C) Western blot showing increased levels of p44 in neurons differentiated from DS and control iPSCs. Representative images are shown in the left panel while quantification is shown in the right panel. Two independent lines are shown. (D) Western blot showing increased levels of p44 in the brain of APP695/swe mice. Representative images are shown in the left panel while quantification is shown in the right panel. NTG, non-transgenic/wild-type. (E) Western blot showing increased levels of p44 in the brain of AICDTg mice. Representative images are shown in the left panel while quantification is shown in the right panel. NTG, non-transgenic/wild-type. All values are mean ± sd. **p < 0.005.

