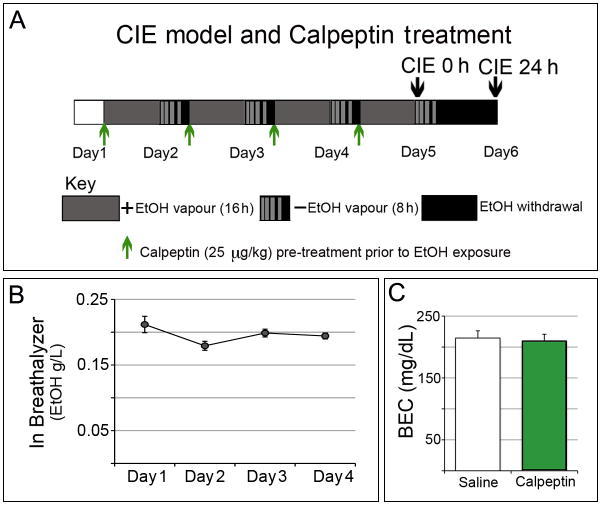
Fig. 1. Timeline of CIE exposure, withdrawal and calpeptin treatment.
(A) Mice (n = 4-6 in each group) were intermittently exposed to EtOH from day 1 through 5; 16 h of continuous EtOH vapor exposure in inhalation chambers (gray box) was followed by 8 h in home cages outside the chambers (striated gray-black box simulating declining BEC); the whole process was repeated 4 times. In parallel, control mice were exposed to air. All mice received pyrazole (1 mmol/kg, i.p.) prior to entry into the respective chambers. Mice were sacrificed at 2 time points: the exposure or CIE 0 h group was sacrificed immediately after the last (4th) exposure on day 5; the withdrawal or CIE 24 h group was given a prolonged withdrawal of a total 24 h (black box). Calpeptin (25 μg/kg, i.p.) was administered prior to each EtOH vapor inhalation (green arrows), whereas the drug control groups received saline correspondingly. (B) Plot of the average breathalyzer readings did not show any significant variation amongst chambers over the complete span of CIE model. (C) BEC levels showed no difference between saline (n = 39) and calpeptin treated (n = 35) groups (p = 0.838).

