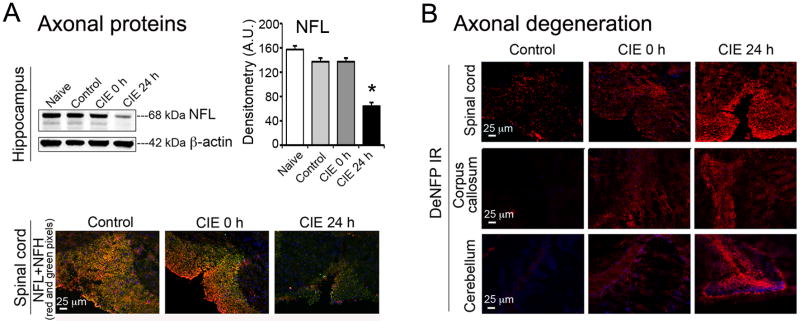
Fig. 3. CIE-induced loss of axonal NFPs and elevation of deNFP in brain and spinal cord.

Double or single immunofluorescent staining was performed in coronal spinal cord slices and longitudinal brain slices to illustrate corpus callosum. Images were captured at 200 × magnification; n = 3-4. (A) Immunoblot and corresponding bar graphs (% change, naïve taken as 100%) showed reduction in NFL (68 kDa) in hippocampus in CIE 24 h compared with naive (*p < 0.0001; n = 4-6). Blots were re-probed for β-actin (42 kDa). Immunofluorescent images (lower panel) indicated substantially reduced levels of NFL (red) and NFH (green) IR in spinal cord in CIE 24 h (withdrawal) compared with control. (B) Immunofluorescent images showed elevated levels of deNFP in spinal cord, corpus callosum and cerebellum, indicating significant axonal degeneration in CIE 24 h compared to control.
