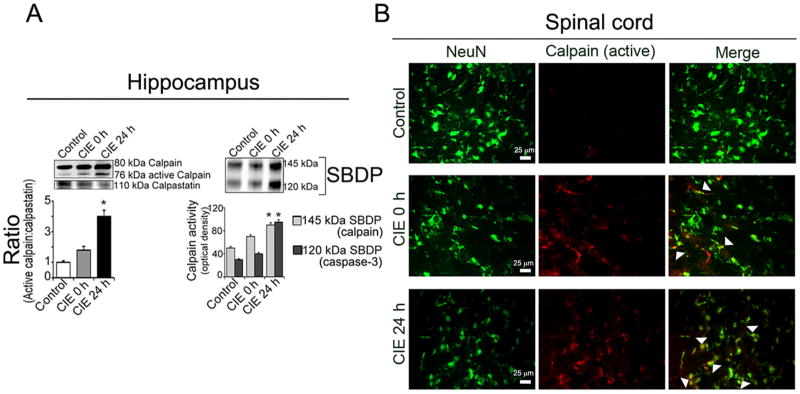
Fig. 4. CIE-induced upregulation of calpain expression and activity in hippocampus and spinal cord.
(A) Elevated ratio of active calpain: calpastatin following exposure compared to control, which intensified during withdrawal. Increased levels of calpain activity was indicated by increased levels of 145 kDa calpain specific as well as 120 kDa caspase-3 SBDP following CIE specifically in CIE 24 h (withdrawal) compared to control; (n = 4, *p < 0.01). (B) Double immunofluorescent staining in cross section of cervical spinal cord, with active calpain and NeuN, showed co-localization following CIE exposure compared to control; greater intensity was seen in CIE 24 h than CIE 0 h. Images in the panel of active calpain staining are also suggestive of other neural cells that might be positively stained with active calpain in both CIE 0 h and CIE 24 h.

