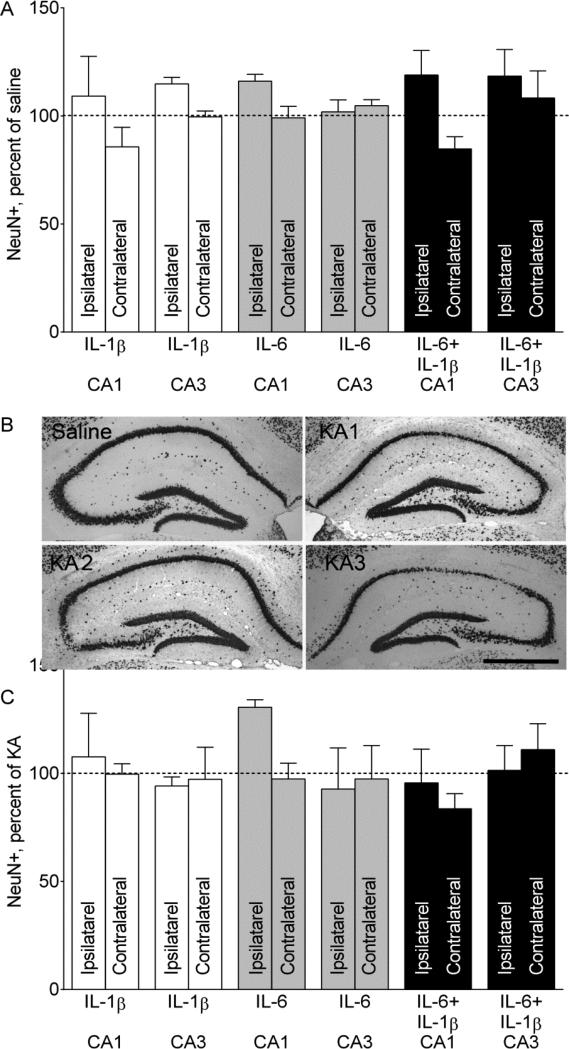
Fig. 4. NeuN- positive cell counts in the hippocampus.
A. NeuN positive cell counts after prenatal cytokine exposure only. Administration of neither of the cytokines, nor of their combination produced neurodegeneration in the hippocampus. Ipsilateral and Contralateral refer to the site of saline injection. Data are shown as Mean±SEM per cent of NeuN-positive cell counts in the offspring of saline-treated mice. 2-Way ANOVA+Sidak's multiple comparison test. Interaction F=1.346, p>0.05; effects of prenatal treatment F=0.703, p>0.05. B. Examples of NeuN immunostaining a Saline/Saline (noted as Saline) and three different Saline/KA (noted as KAx) mice. In Saline and KA2 animals, left (injected) hippocampi, and in KA1 and KA3- hippocampi contralateral to the injection are shown. Various degrees of neurodegeneration in the CA1, CA3 and hilar areas are observed. KA1- very mild CA1 and CA3 cell loss; KA2- moderate CA3 injury; KA3- moderate CA1 and hilus injury. Scale bar- 500 uM. C. NeuN-positive cell counts after intrahippocampal KA administration. Administration of neither of the cytokines, nor of their combination exacerbated KA-induced neuronal cell loss in the hippocampus. Ipsilateral and Contralateral refer to the site of KA injection. Data are shown as Mean±SEM per cent of NeuN-positive cell counts in the offspring of Saline/KA mice. 2-Way ANOVA+Sidak's multiple comparison test. Interaction F=0.69, p>0.05; effects of prenatal treatment F=1.02, p>0.05; effects of seizures F=0.41, p>0.05.

