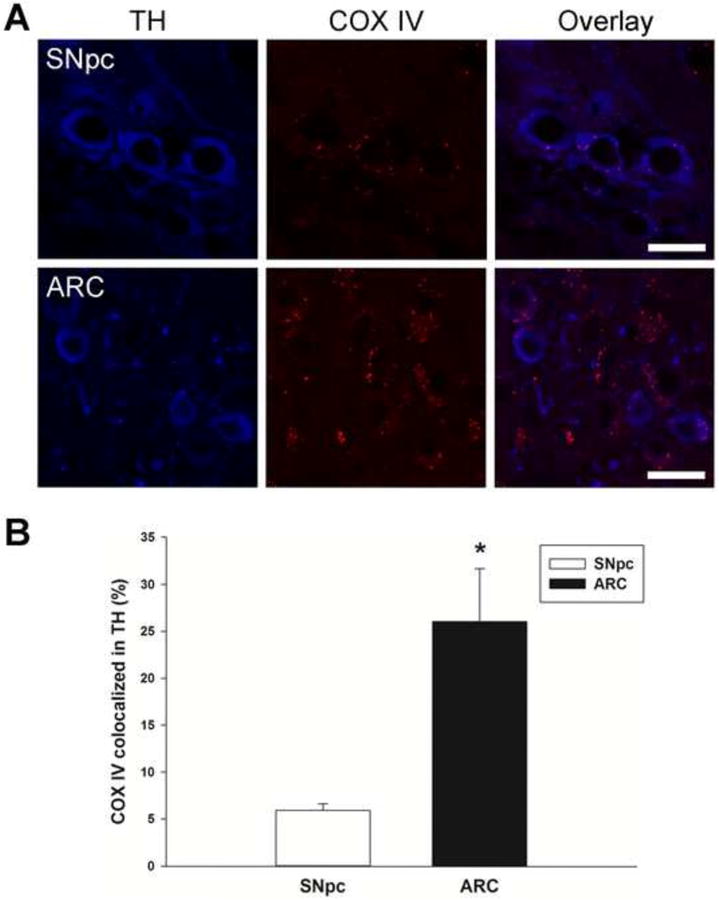
Figure 1. Comparison of mitochondrial content in cell bodies of TH immunoreactive neurons in the SNpc and ARC.

A, Representative high power confocal microscopic single plane focal images are depicted for the SNpc and ARC. GFP-LC3 mice were perfused with fixative and brains were removed and cut into 20 μm sections for immunohistochemical analyses. Mitochondrial distribution in TH immunoreactive neurons was quantitated in SNpc at approximately Bregma -3.16 and in ARC at Bregma -1.46. Blue represents staining for TH and red represents COX IV staining in mitochondria. (Scale bar = 20 μm). B, Representative bar graphs of the percentage of COX IV co-localized with TH in SNpc and ARC. Pixels were quantified by upper right quadrant scatter plot analyses, and the percent distribution of COX IV within TH neurons was calculated. Percent values were converted to parametric values by ASIN(SQRT(% value/100)). Columns represent the means and error bars +1 standard error of the mean. * indicates percentage COX IV co-localization in TH immunoreactive neurons in the ARC (filled column) that were significantly different (p<0.05) from those in the SNpc (open column).
