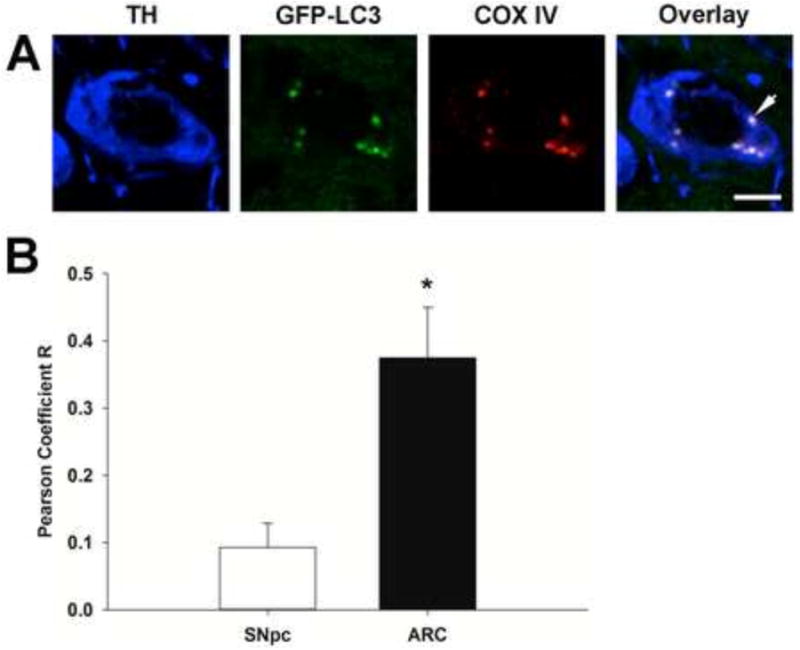
Figure 2. Comparison of the co-localization of mitochondria with autophagosomes in TH immunoreactive neurons in the SNpc and ARC.

Representative confocal microscopic single plane focal image of a single cell in the ARC (A). Blue represents staining for TH, GFP-LC3 labeled autophagosomes were visualized as green puncta, and red represents COX IV staining in mitochondria. Arrow denotes co-localization of GFP-LC3 and COX IV in a TH immunoreactive neuron. Scale bar is 5 μm. (B); Pearson Coefficient of mitochondrial co-localization with autophagosomes in TH immunoreactive cells in the SNpc and ARC. Pearson coefficients were measured using Fiji with Image J software. TH immunoreactive neurons were masked and pixels with TH immunoreactive neurons were analyzed for co-localization using Fiji Coloc_2. Columns represent the means and error bars +1 standard error of the mean. * indicates Pearson coefficients in TH immunoreactive neurons in the ARC (filled column) that were significantly different (p<0.05) from those in the SNpc (open column).
