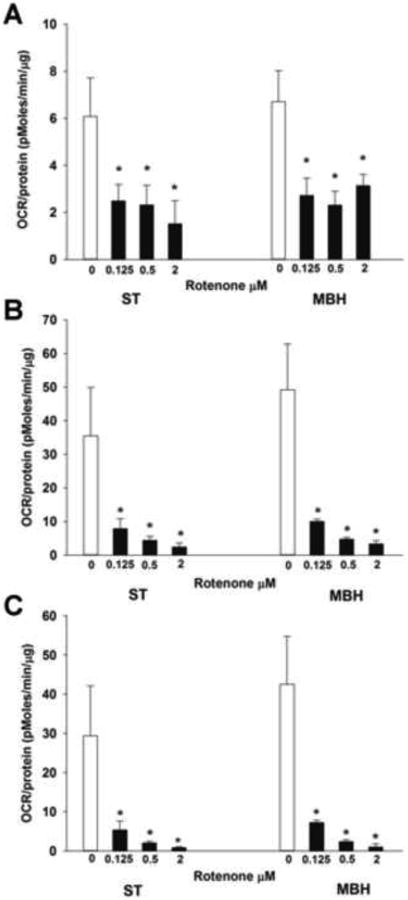
Figure 4. Comparison of the effects of rotenone on mitochondrial aerobic respiration in synaptosomes derived from the ST and MBH.

OCR measurements were performed using a Seahorse XF24 analyzer, with twenty μg of synaptosomal protein derived from each region yeilding a respiratory control ratio' (RCR') of greater than 3. OCR (pmoles/min/μg) was measured beginning 5 min after treatment with either vehicle (incubation buffer) or rotenone (0.0125, 0.25, or 2 μM). Columns represent mean OCR of synaptosomal mitochondria basal (A), maximum (B) and spare (C) respirations, and vertical lines + 1 SEM of 3 determinations. * indicates values in rotenone-treated synaptosomes that were significantly different from vehicle-treated (0 μM) controls, p < 0.05.
