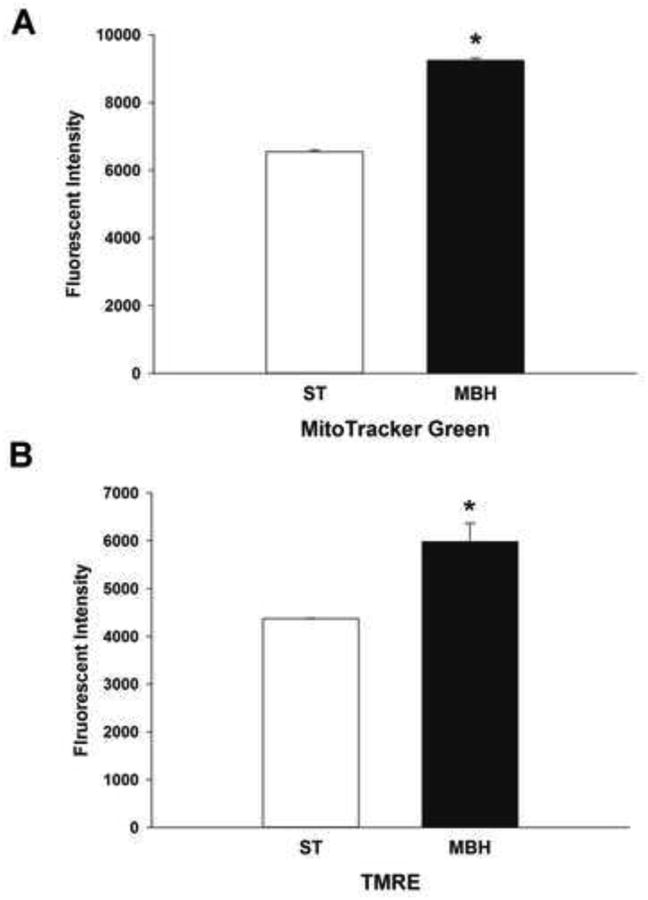
Figure 5. Flow cytometric analysis of mitochondrial mass and membrane potential in synaptosomes derived from the ST and MBH.

Flow cytometric assessment of mitochondrial mass and membrane potential were performed using the fluorescent dyes MitoTracker Green and TMRE, respectively. Twenty μg of synaptosomal protein was examined for mitochondrial mass and membrane potential by flow cytometry. Columns represent the mean fluorescent intensity of MitoTracker Green (A) and TMRE (B) in ST- and MBH-derived synaptosomal mitochondria and vertical lines + 1 SEM of determinations in 3 mice. * indicates values in MBH-derived synaptosomes that are significantly different (p < 0.05) from those derived from the ST.
